Simple engineering data, experiment parameters stored in CSV file
can be imported into sigclear platform by
sgloadcsv
We use the air measurements data in NASA Atmospheric Tomography Mission
to show how simple it is to import CSV file.
The NASA Mission measured the air compositions from 2009 to 2018.
The CSV dataset can be
Download here.
- In the CSV file, there are lots of variables recorded.
As an example here, we load the age of air (AoA)
and the argon/nitrogen (Ar/N2) ratio from the csv file.
from experiment import *

Process('raw', './ArN2_AirAge_Trace_Gases.csv',
	'sgloadcsv in.select=ArN2,AoA')
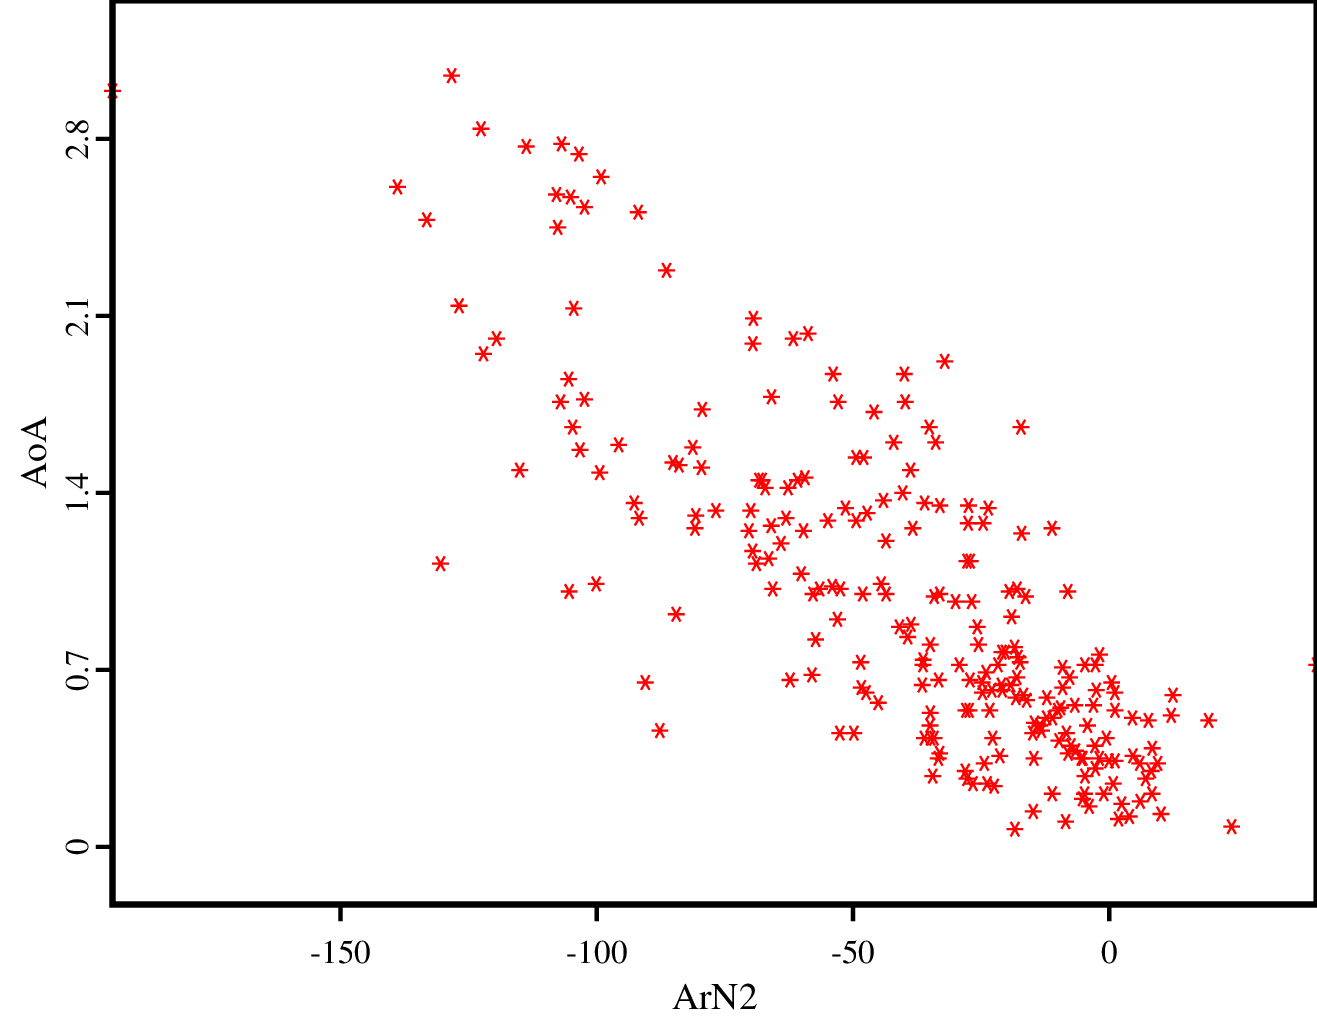
The output has two scalar fields ArN2 and AoA,
and yields a column for each row in the CSV file.
- The scalar fields ArN2 and AoA
can be transformed into vectors as follows
Figure('./AoA.png', 'raw',
	'''
	sgsort key=group,index
	| sgfieldout fields=ArN2,AoA
	| sggraphps x=ArN2 y=AoA AoA.style=* AoA.color=FF0000
	''')
The generated figure is as follows

References:
- Download Experiment
-
Birner, B., M. Chipperfield, E.J. Morgan, and R.F. Keeling. 2020. ATom: Age of Air, ArN2 Ratio, and Trace Gases in Stratospheric Samples, 2009-2018. ORNL DAAC, Oak Ridge, Tennessee, USA. https://doi.org/10.3334/ORNLDAAC/1788
- load and combine
lunar reflectance spectra distributed in different CSV files

