sigclear-plot provides convenient tools
to help researchers and engineers QC their experiment data.
The plot and graph programs can produce high quality vectorized figures,
with multi-page, multi-plot and adaptive features,
automatically based on the QC datasets.
Features
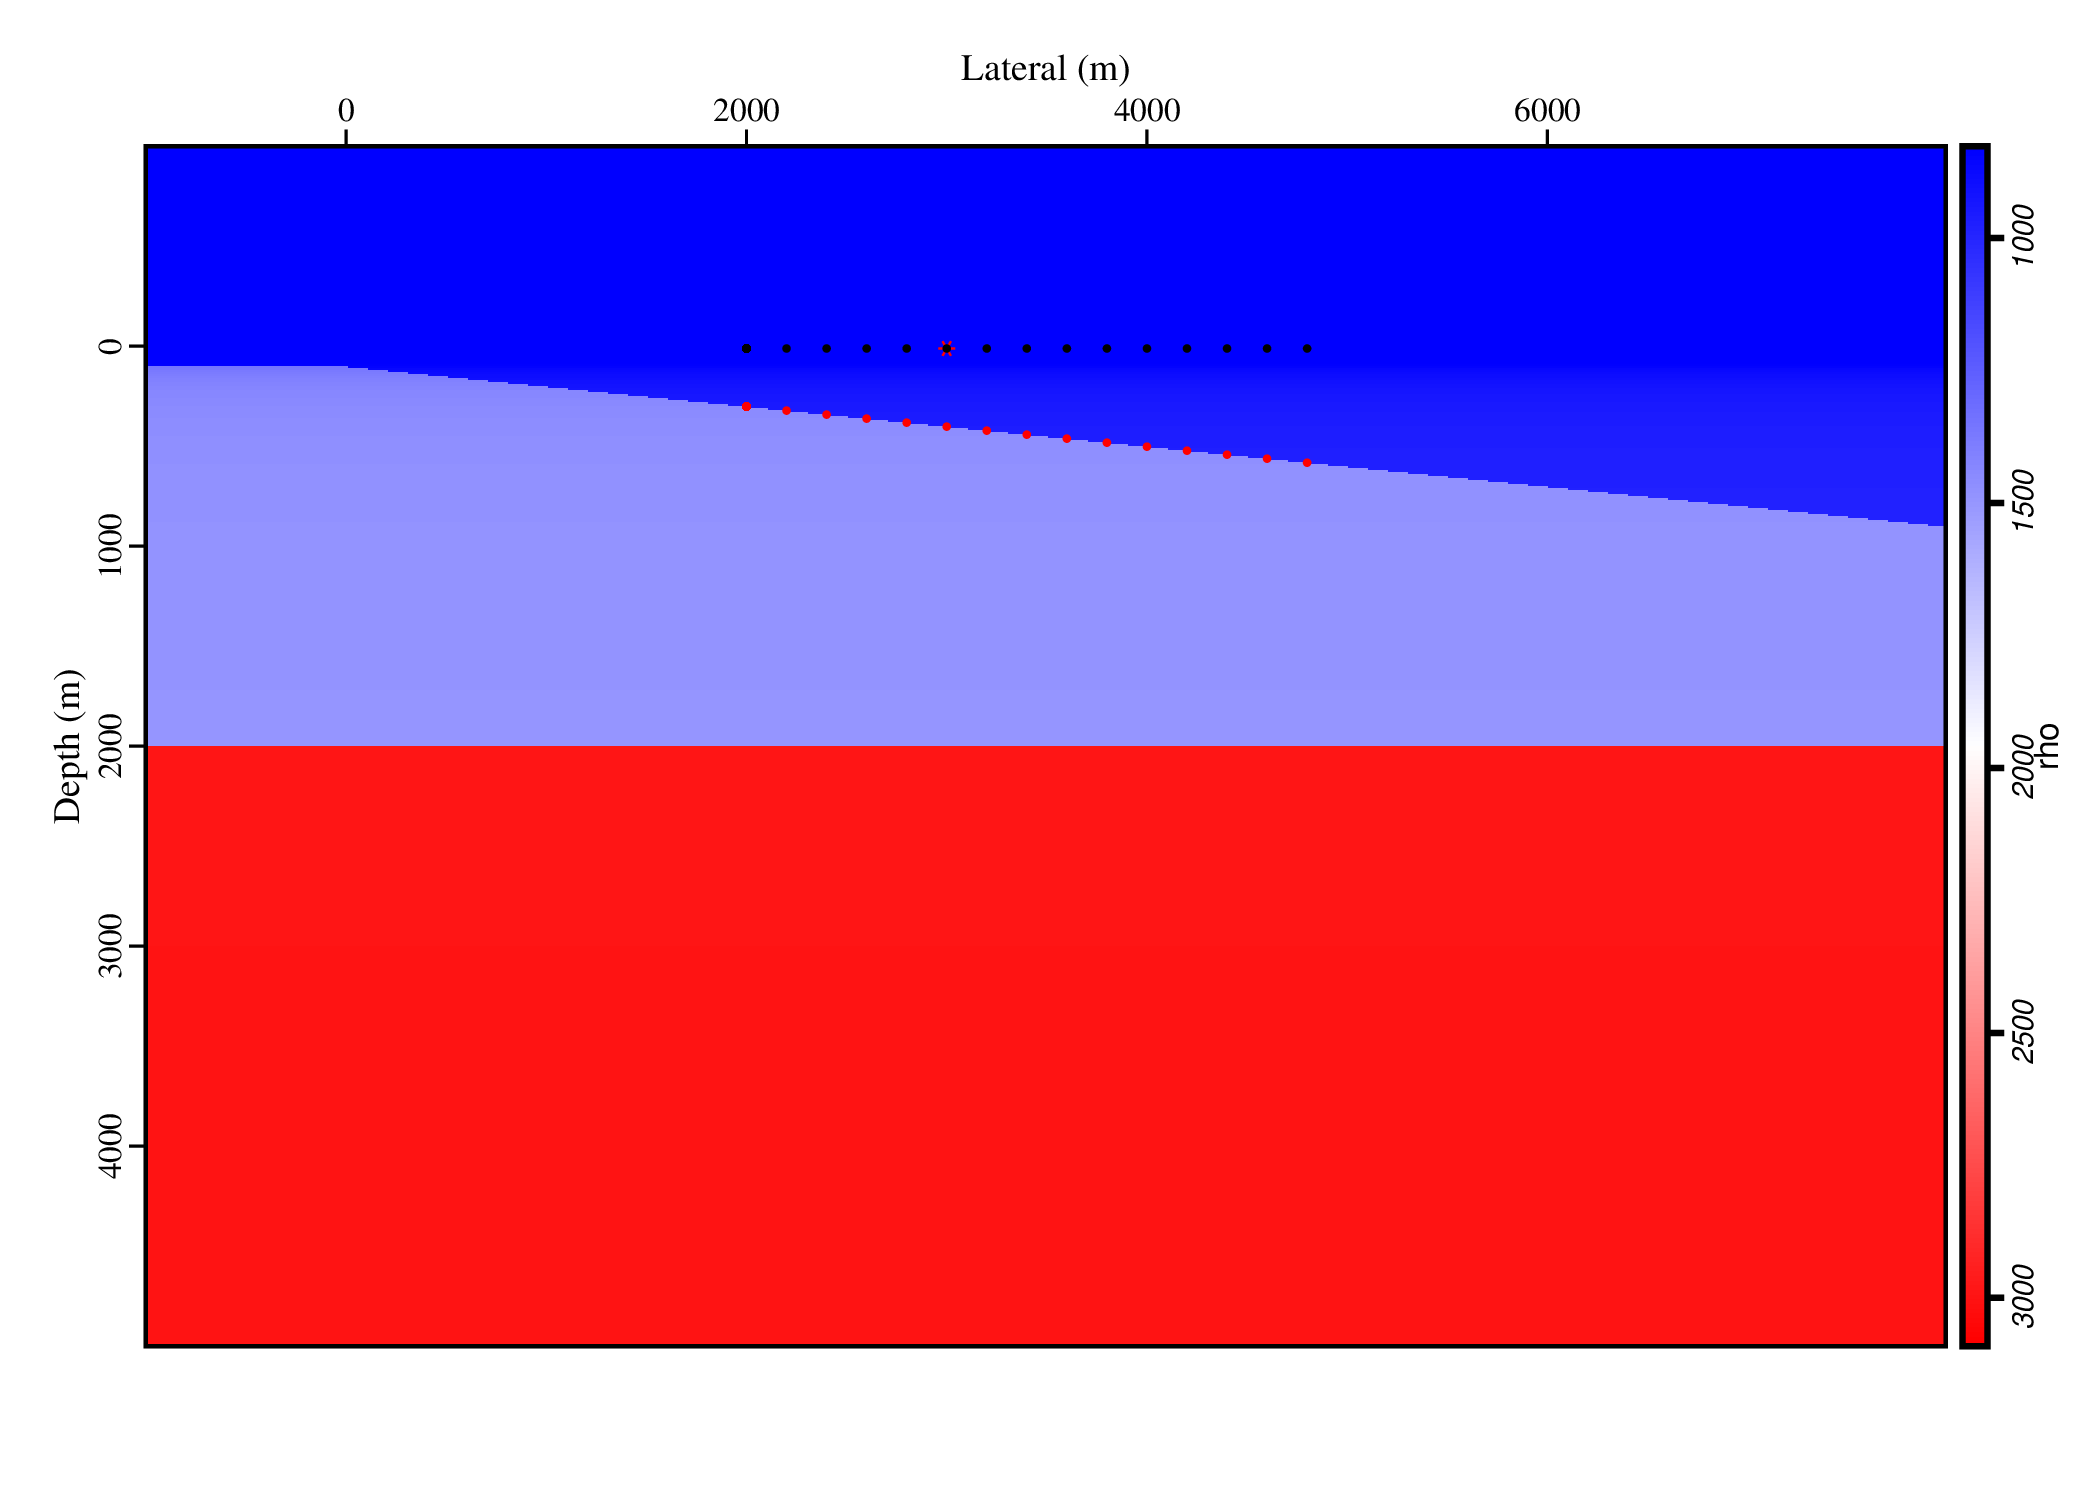
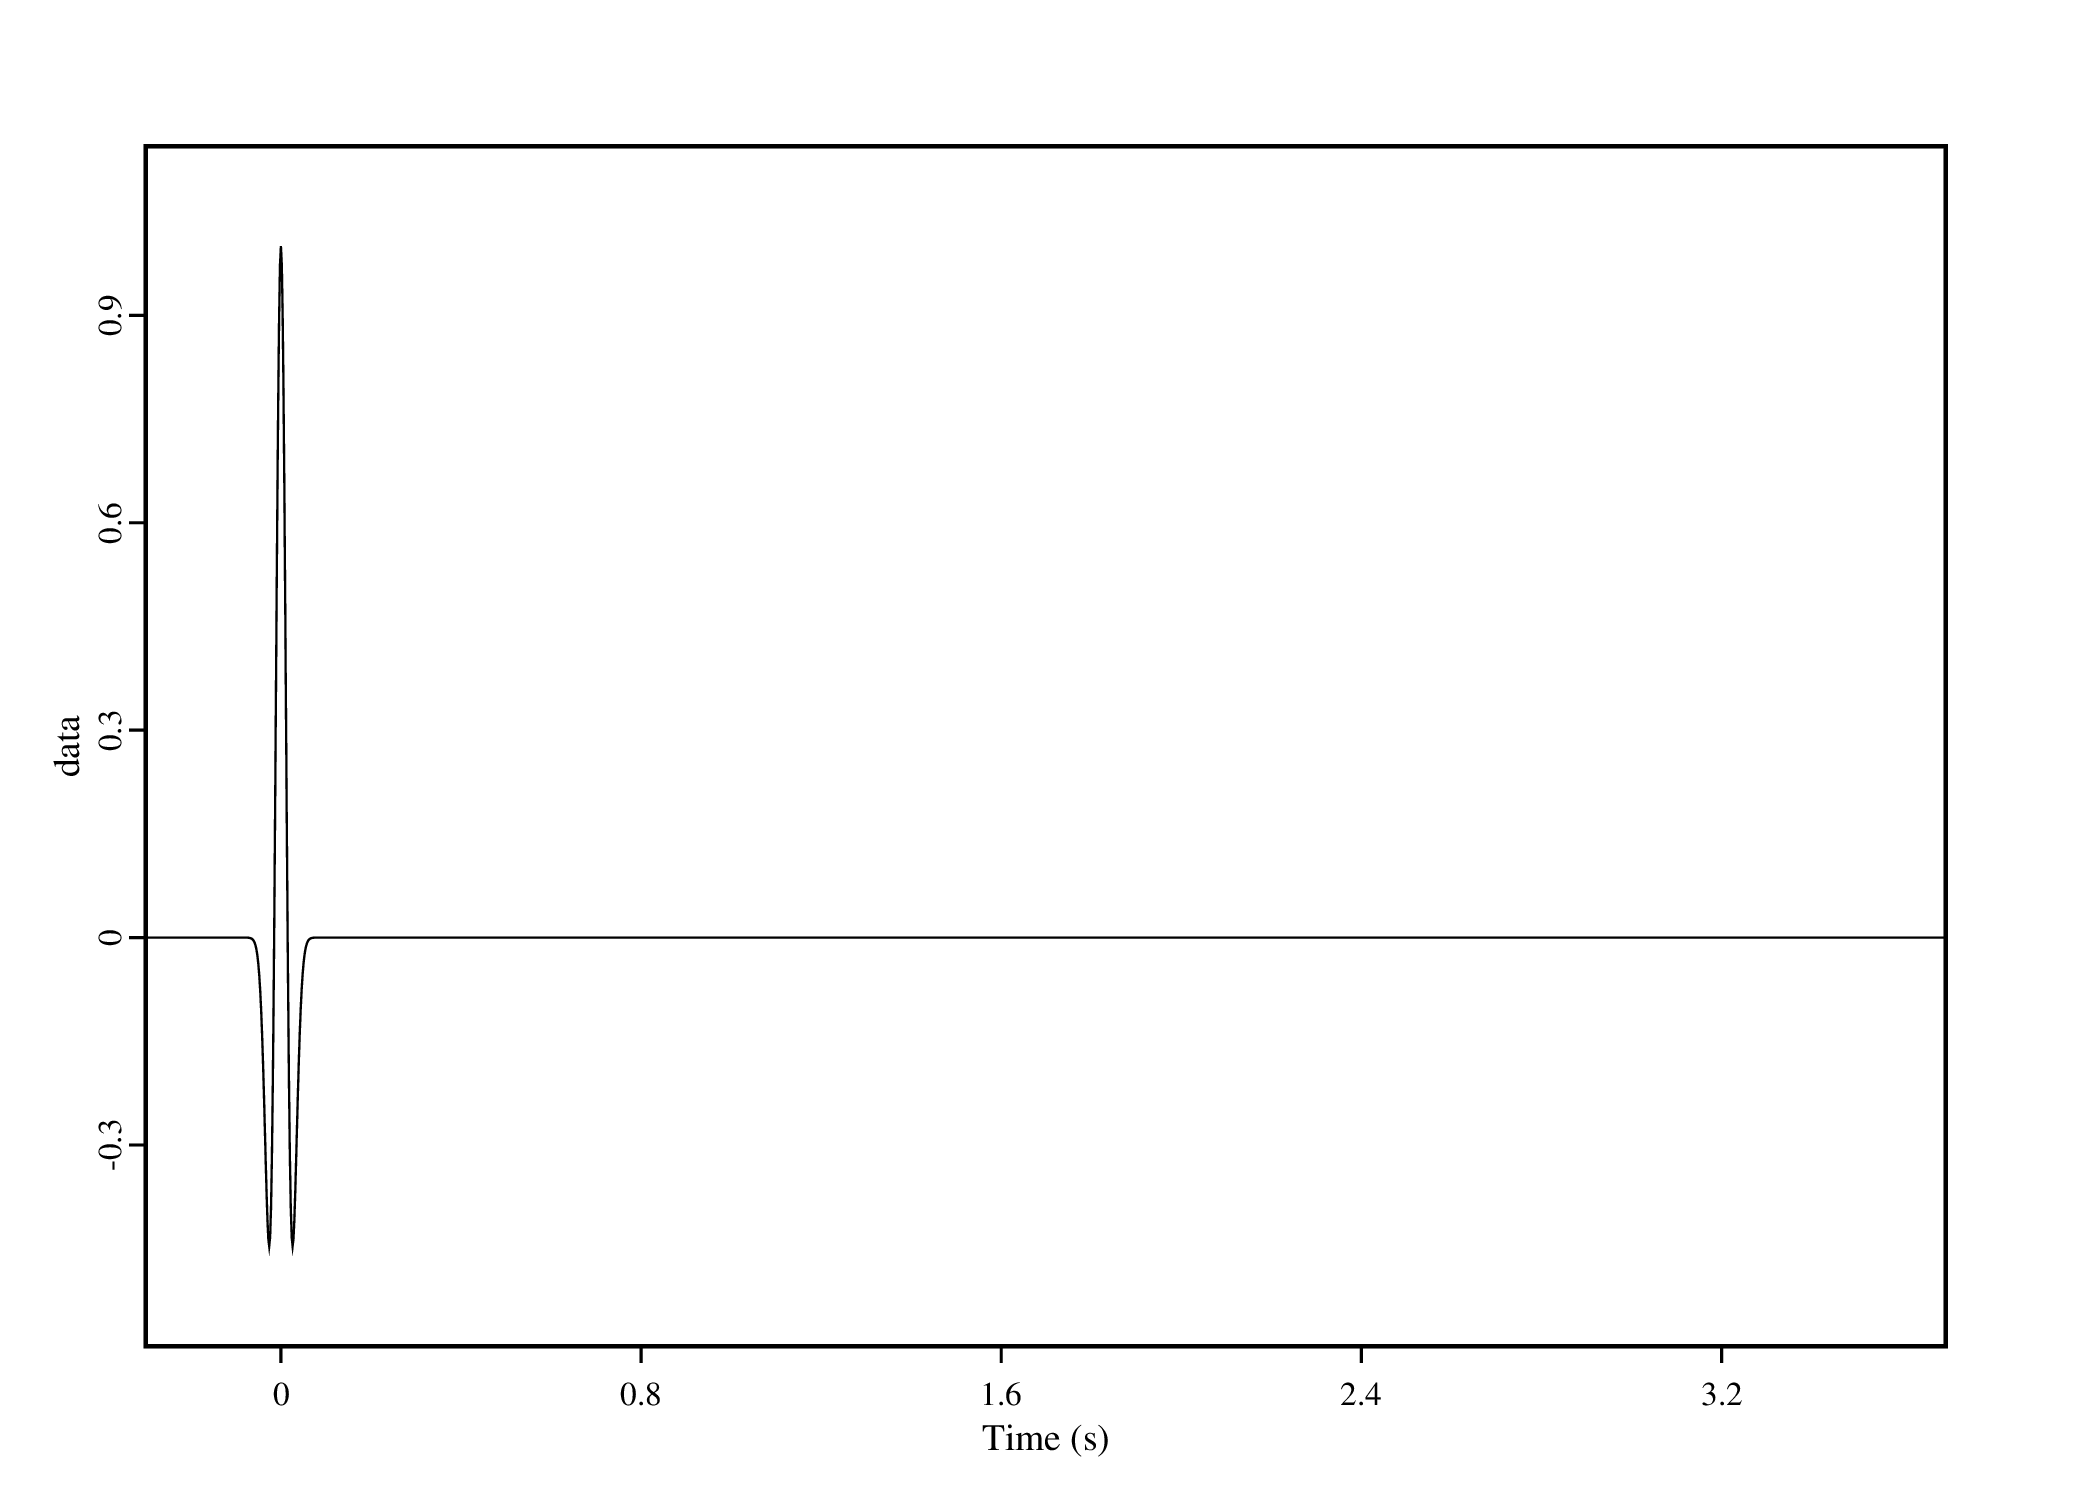
convenient data QC
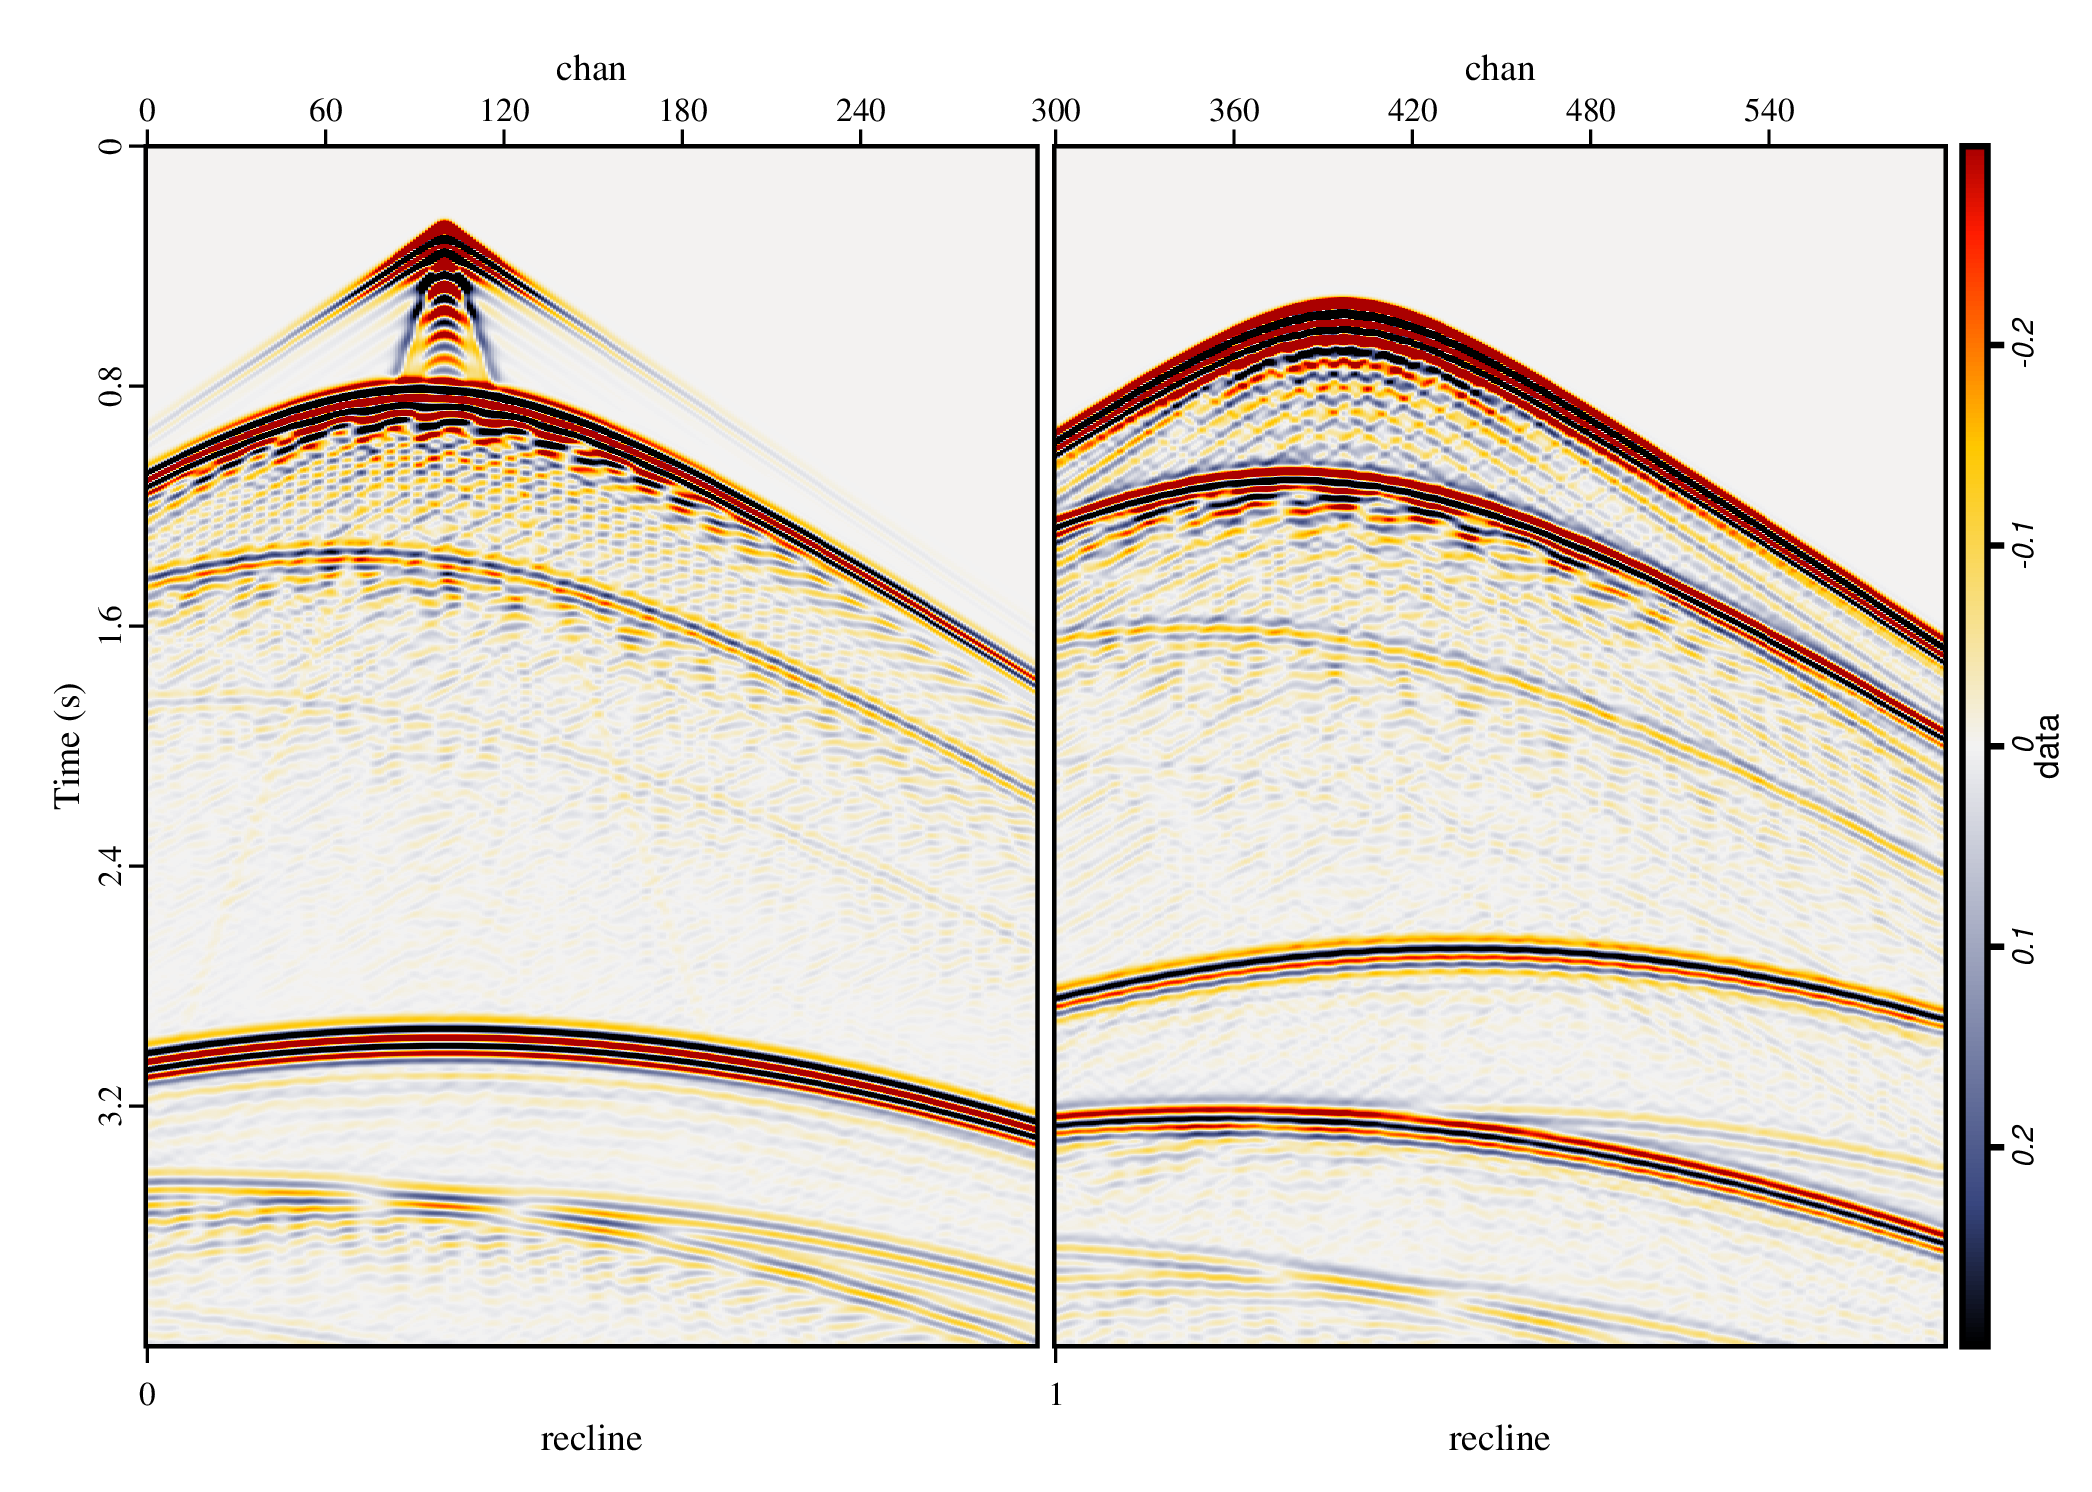
Figures automatically generated based on the dataset structure- multi-pages for each group
- multi-plots for each subgroup
display styles and features
- convenient style control for vectors
- adaptive features based on data fields
- optimized default feature
high quality figures
- postscript vectorizing engine