lunar penetrating radar data denoise
The lunar penetrating radar data was automatically acquired by the YuTu-2 rover. The radiative noises in the outer space and the activities of rover itself may be noisy to the radar measurements. This example shows how to use the sigclear platform to do basic denoise for the lunar penetrating radar data.
We assume the LPR datasets has been loaded into sigclear dataset, or you can do it by the following guide:
load lunar penetrating radar data
about the experiment script for data denoise
The experiment script for data denoising is: j02_lpr_filt.py
- The working frequency bands for the three antennas are as follows:
- CH-1 40Mhz-80MHz
- CH-2A 250MHz-750MHz
- CH-2B 250MHz-750MHz
- The band pass filter is implemented with a lowpass filter followed by a highpass filter.
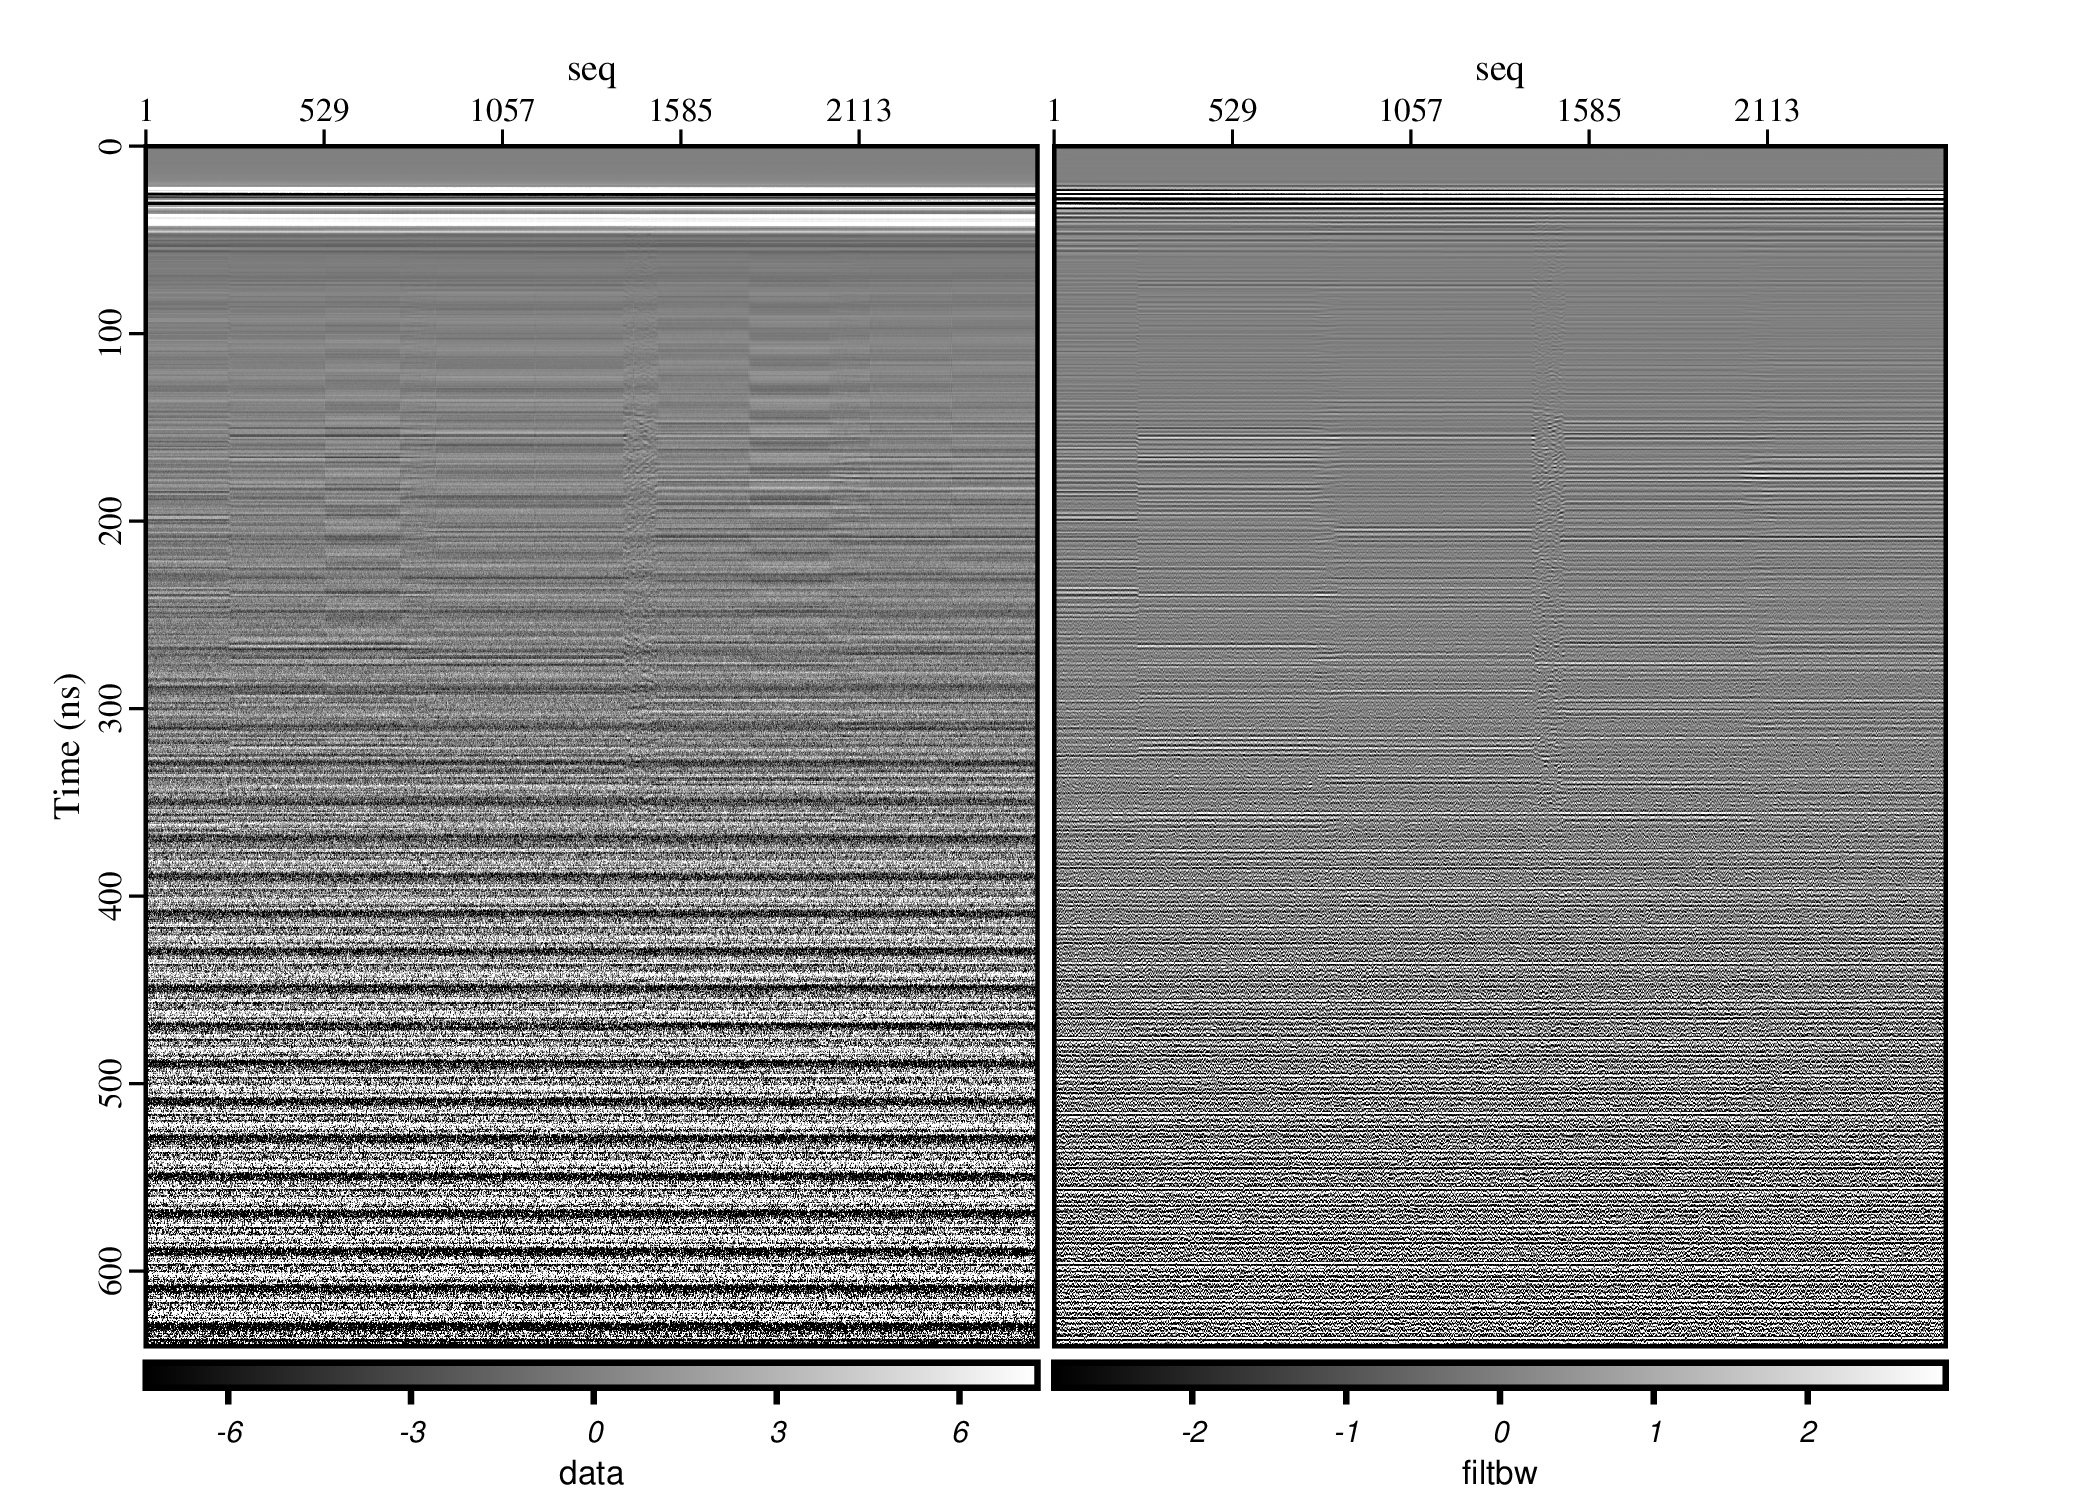
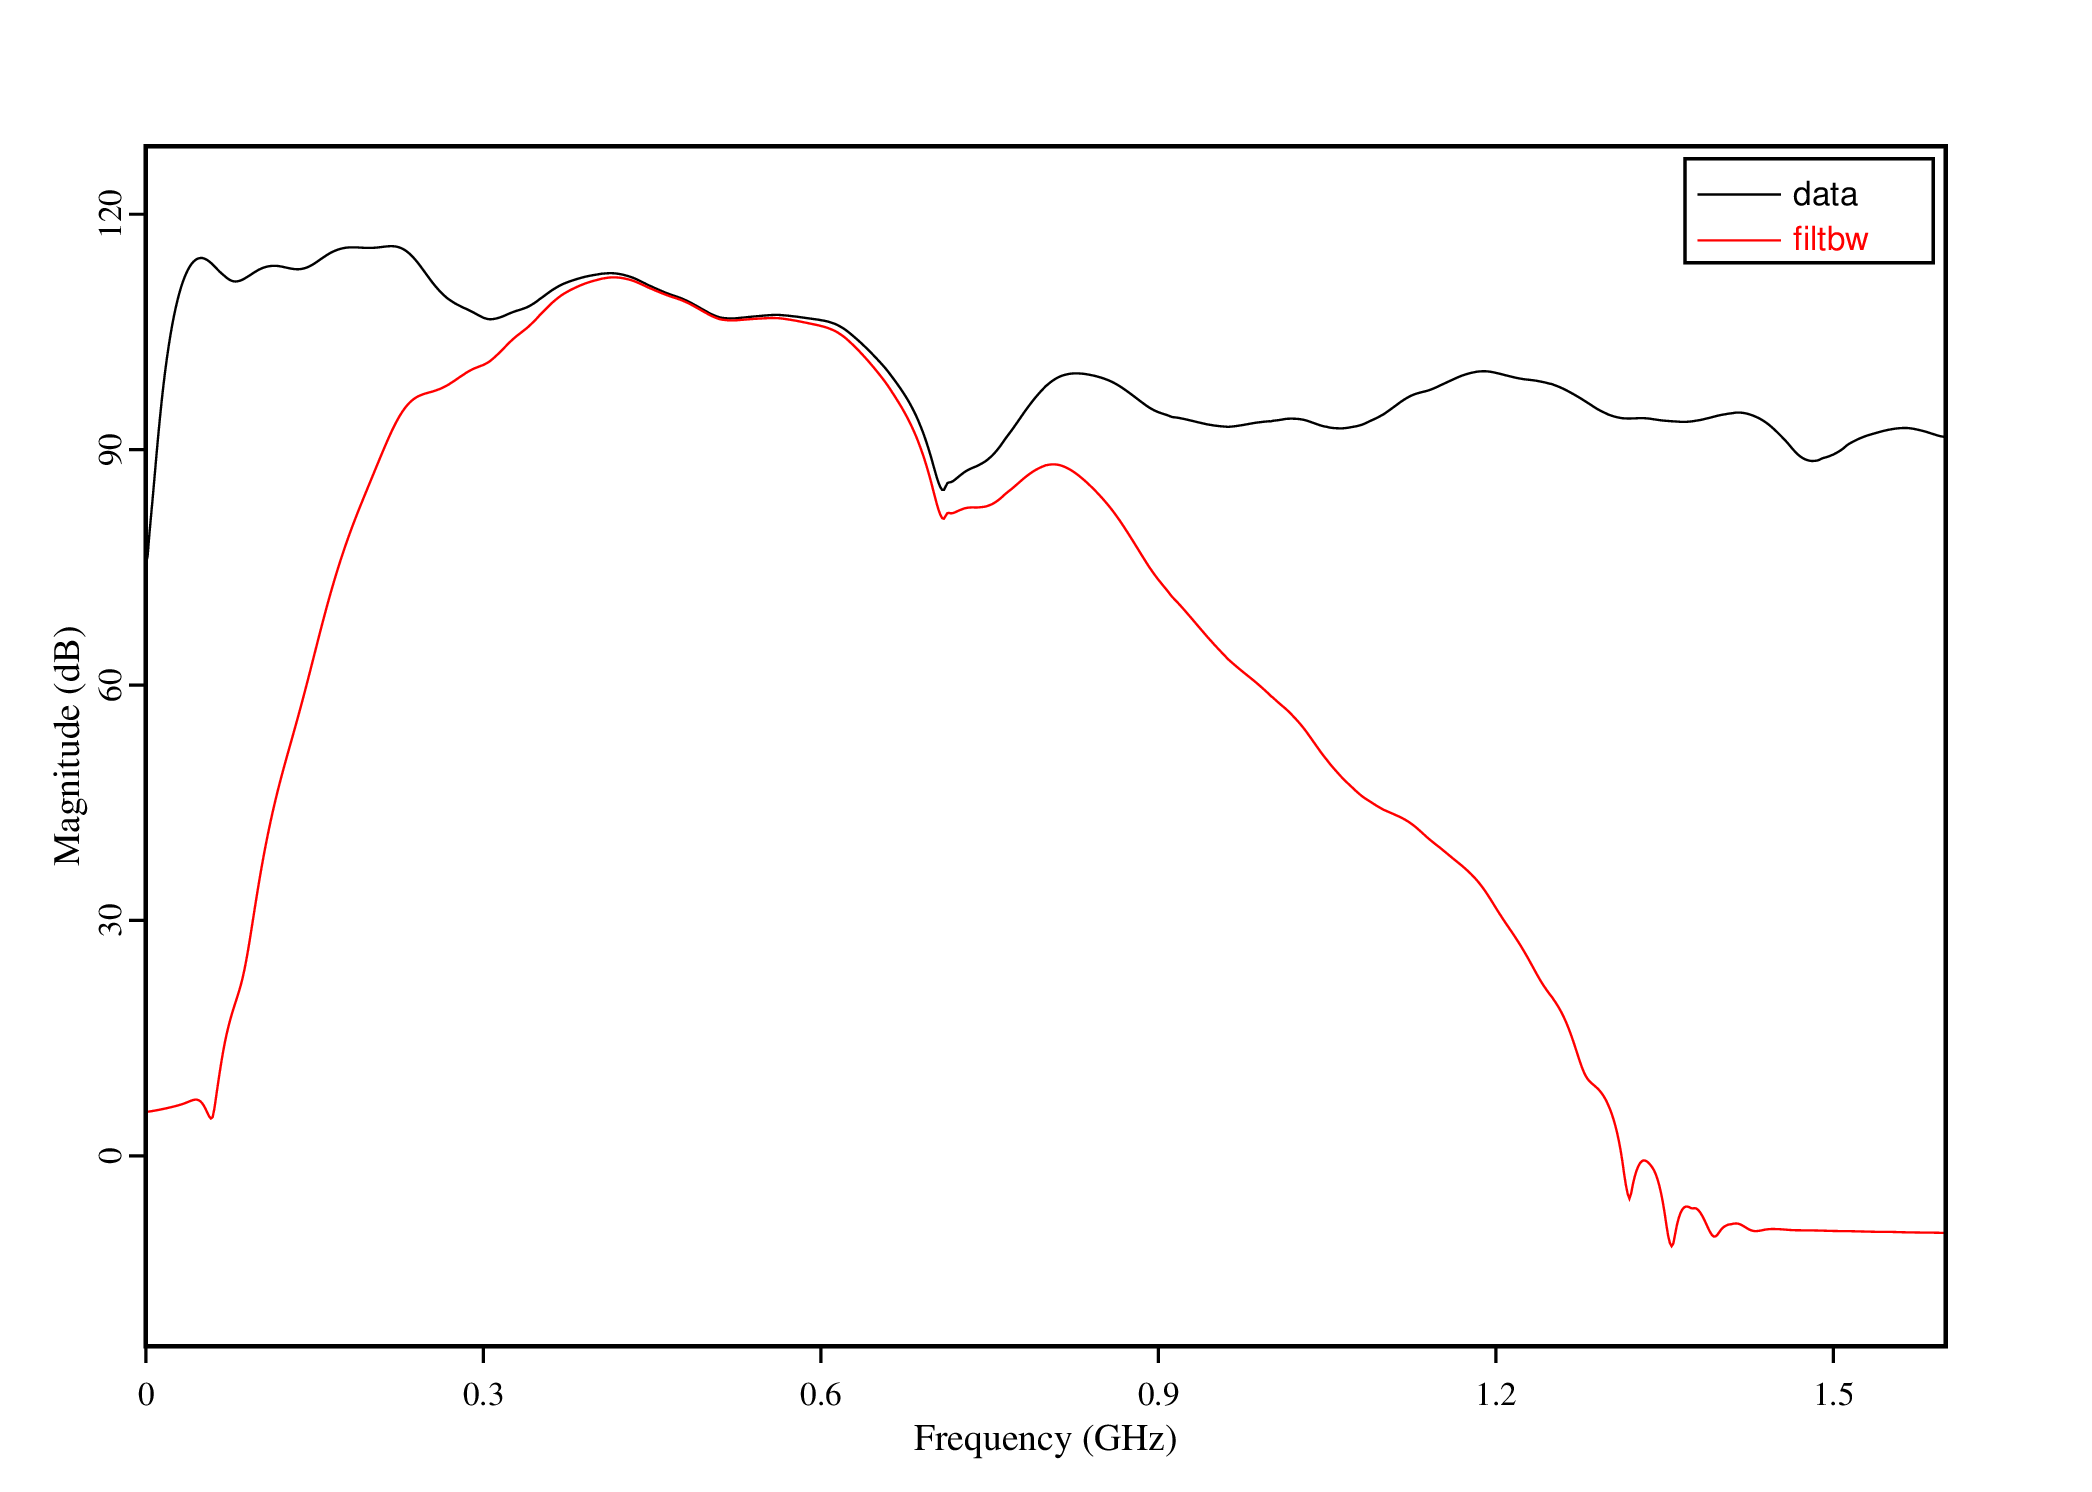
- If the qc option is given, we combine the input and output data of the Butterworth filter for comparison. We generate a plot for time domain comparison (as the radar signals decays as it propagates, we add divergence correction before plotting for detail comparison), and a graph for frequency comparison.
- To do the denoise for the three antennas,
The denoise comparison for antenna-2A are as followsLPR_FiltBW('1', fmin=0.04, fmax=0.08, qc=0) LPR_FiltBW('2A', fmin=0.25, fmax=0.75, qc=0) LPR_FiltBW('2B', fmin=0.25, fmax=0.75, qc=0)

from experiment import *

def LPR_FiltBW(ch, fmin=0.04, fmax=0.08, qc=None):
	Process('filtbw-ch%s'%ch, 'data-ch%s'%(ch),
		'''
		sgfilterbw phase=zero fc=%f type=highpass
		| sgfilterbw phase=zero fc=%f
		'''%(fmin, fmax))
	if qc != None:
		Process('qc-filtbw-ch%s'%ch, 'data-ch%s filtbw-ch%s'%(ch, ch),
			'''
			sgcat -mode=vector ${SOURCES[1:]}
			| sgwindow gmin=%d gmax=%d
			| sgfieldmath data1.rename=filtbw
			'''%(qc, qc))
		Figure('./filt-ch%s.png'%ch, 'qc-filtbw-ch%s'%ch,
			'''
			sggain div.vrms=0.25 div.texp=3
			| sgplotps left.label="Time (ns)"
			''')
		Figure('./freq-filt-ch%s.png'%ch, 'qc-filtbw-ch%s'%ch,
			'''
			sgfft1 output=magnitude
			| sgstack
			| sggraphps y=data,filtbw filtbw.color=FF0000
			  subtitle="Magnitude (dB)" legend=topright
			  bottom.label="Frequency (GHz)"
			''')
