load lunar penetrating radar data
YuTu-2 moon rover landed on the moon's farside in the Chang'E-4 Mission in January 2019. Scientific devices including Terrain Camera, Low frequency spectrometer, Lunar Lander Neutron and Dosimetry and Lunar Penetrating Radar (LPR) were equipped on YuTu-2 for the geological and chemical analysis. All the measurements by these scientific devices on YuTu-2 are stored in the datasets of PDS 4 format. This experiment uses the lunar penetrating radar data to show how easy to load and analyze these datasets in our sigclear platform.
More details on the Chang'E-4 Mission and the YuTu-2 rover can be found here.
download the field LPR datasets
- create a folder for experiment, such as ~/ce4lpr/ and create a subfolder for the raw datasets
- mkdir ~/ce4lpr
- cd ~/ce4lpr
- mkdir DATA
- There are three LPR antennas equipped on YuTu-2: Antenna-1, Antenna-2A, Antenna-2B. The Antenna-1 is low frequency radar (centered at 60MHz), while 2A and 2B are high frequency radars (centered at 500MHz). The LPR datasets are stored as binary PDS 4 format ending with .2B, and its XML description file ending with .2BL, All the LPR datasets can be downloaded from: https://moon.bao.ac.cn (Please download all the *.2B datasets into ~/ce4lpr/DATA).
about the experiment script for data loading
The experiment script for dataset loading is: j01_lpr_load.py
-
As the measurements of the three onboard antennas are different,
in sampling intervals and number of samples,
Different loading parameters is needed,
(all parameters can be fixed through the .XBL description information).
For convenience, we define a function LPR_Load for the data loading
from experiment import * def LPR_Load(ch, option="", qc=None):- ch is the specific channel of the antenna, can be "1", "2A", "2B"
- option is the loading options for the antenna
- qc is group index of the loaded raw datasets for QC
- in the function, we loop all the binary .2B files for the specific antenna, and stored the file in lst
- In the loading Process, all the .2B datasets are merged by cat firstly. Then we use the universal binary loader sgloadbin to load the merged datasets into sigclear datasets. sgloadbin can handle binary data stored in different format, encoding and of different endian system. The data fields for loading and parameters for each field of the raw .2B data can be find from the .2BLtext description file.
- If the qc option is given, we do the QC plotting
- Now we load the dataset for Antenna-1:
From the description file, a data record has a length of 32883 bytes.
And the most significant data field
is sampled at 2.5ns, with 8192 samples for each record.
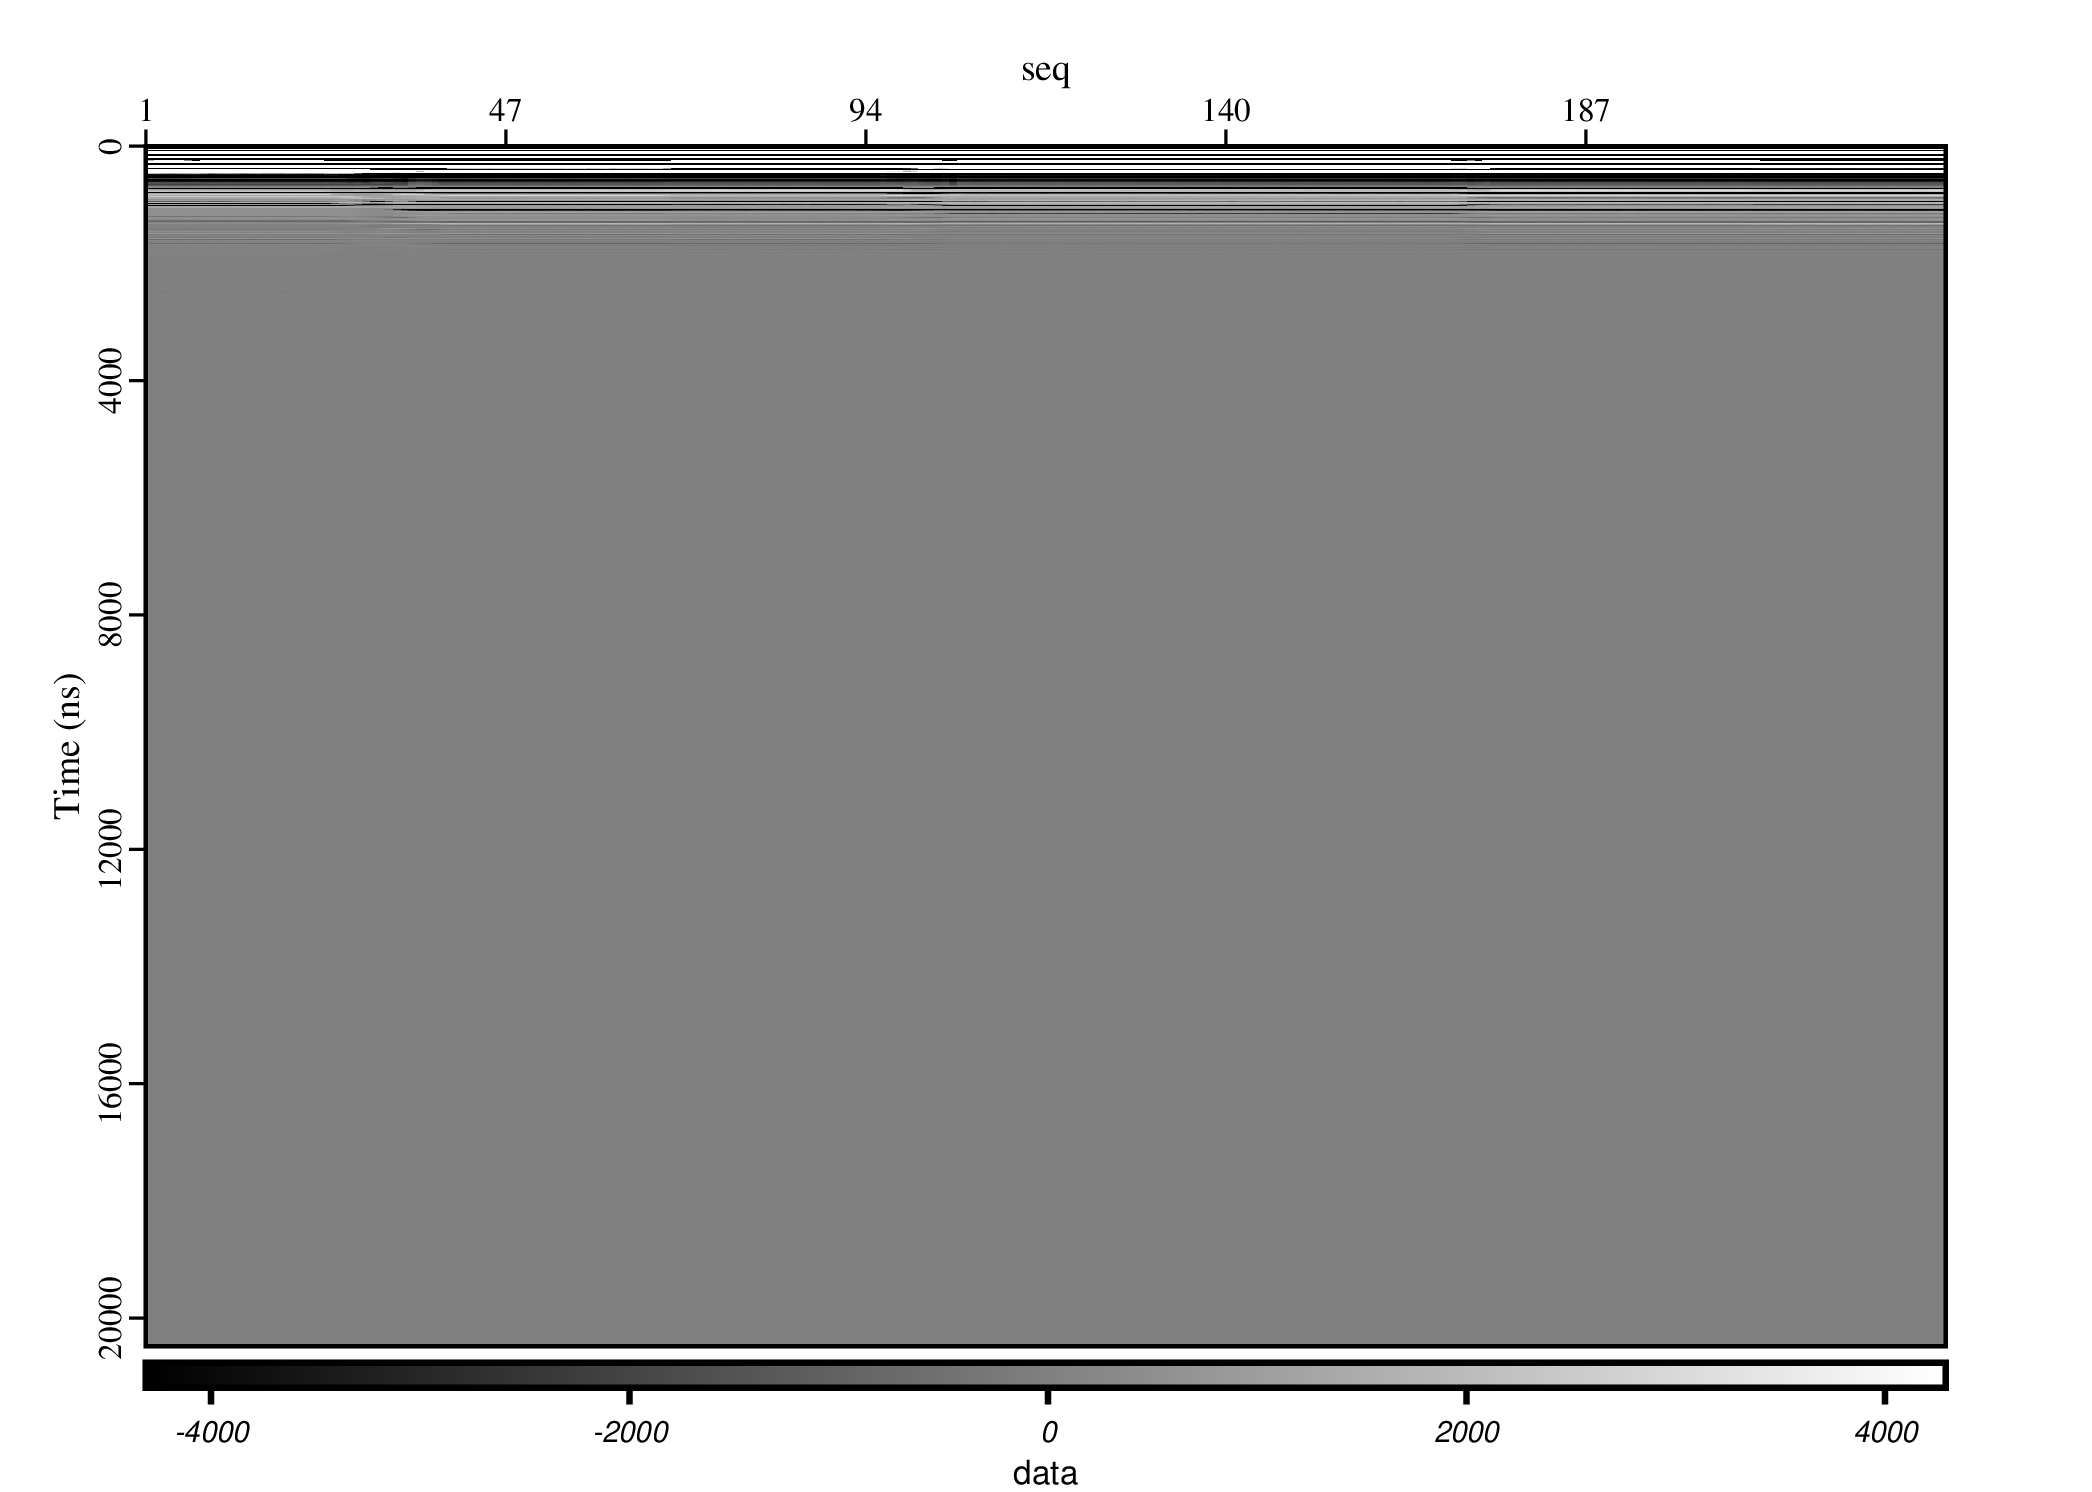
And we QC the 10th group after loading.
LPR_Load('1', "in.colsz=32883 data.len=8192 data.dt=2.5", qc=10)
The antenna-1 is working in low frequency, targeting for the deep structures. More of the radar signals decayed quickly as it went into deep subsurface.
Similarly, the measurements of antenna-2A and 2B can be loaded as follows
LPR_Load('2A', "in.colsz=8307 data.len=2048 data.dt=0.3125", qc=10) LPR_Load('2B', "in.colsz=8307 data.len=2048 data.dt=0.3125", qc=10)
	lst=[]
	for it in Glob('DATA/CE4_GRAS_LPR-%s*.2B'%ch):
		lst.append(str(it))
	Process('data-ch%s'%ch, lst,
		'''
		cat ${SOURCES[1:]}
		| sgloadbin %s in.endian=LSB
		  out.fields=second,millisec,vel,xpos,ypos,zpos,xref,yref,zref,pitch,roll,yaw,mode,seq_ch1,seq_ch2,antenna,data
		  second.format=u32 second.endian=MSB second.start=4
		  millisec.format=s16 millisec.endian=MSB
		  vel.format=fp32 vel.endian=MSB
		  xpos.format=fp32 xpos.endian=MSB
		  ypos.format=fp32 ypos.endian=MSB
		  zpos.format=fp32 zpos.endian=MSB
		  xref.format=fp32 xref.start=38
		  yref.format=fp32
		  zref.format=fp32
		  pitch.format=fp32 pitch.start=50
		  roll.format=fp32
		  yaw.format=fp32
		  mode.format=u8 mode.start=73
		  seq_ch1.format=u16 seq_ch1.start=109
		  seq_ch2.format=u16
		  antenna.format=u8
		  data.format=fp32 data.len=2048 data.dt=0.3125
		| sgattribute group:k=second index:k=millisec
		| sgfieldmath time:d="second+0.001*millisec"
		  seq:i="(antenna==17)*seq_ch1+(antenna>20)*seq_ch2"
		| sgsort key=xref,seq
		'''%option)
	if qc != None:
		Figure('./data-ch%s.png'%ch,
			'''
			sgwindow gmin=%d gmax=%d
			| sgplotps left.label="Time (ns)"
			'''%(qc, qc))
